The rapidly emerging Private Companies asset class or investment category has become the best answer for how 80% declines for the Dow and the S&P 500 from their recent all-time highs are possible. See my 03/17/25, “Secular Bear Underway, How 80%+ Decline for Dow & S&P Possible?” The Privates asset class was among the original answers to my report and question. A surge of news throughout April and May 2025, has resulted in the transformation from public to Privates for growth investing to be the primary reason for the predicted minimum nine-year decline that is now underway.
The August 2024 “Asset Managers Must Invest in Private Markets Now, Bain Says” Bloomberg article resulted in the private company investing trend moving to the top of my radar screen. The article provided details about non-publicly traded or private assets managed by asset or wealth managers increasing to $65 Trillion by 2032. The projection caught my attention. The total market cap for the S&P 500 at the end of the second quarter for 2024 was $45.1 Trillion.
Below is a list of the articles recommended by SaveChangeWorld.com that have been published primarily by Bloomberg since August of 2024. The green shaded content illustrates the surge of recommended articles since April 2025. My “2025”, Year for Transformation to Private from Public Market Began” is highly recommended.
- Private Markets Hog the Spotlight as Asset Managers Gather in DC, 05/02/25
- Carlyle, State Street Mull Partnership to Tap Retail Wealth, 04/30/25
- Capital Group and KKR Launch Their First Two Public-Private Investment Solutions and Announce Plans to Expand Their Exclusive Strategic Partnership, 04/29/25
- Tomasz Tunguz: Secondaries as the new IPO is no passing fad—it’s a VC evolution, 04/29/25
- Why the Venture Capital Secondary Market Is So Hot Right Now, 04/28/25
- Behind the Vanguard, Blackstone, Wellington Plan to Launch Private Investments, 04/17/25
- Secondary Market in Venture Capital: A Significant Opportunity Going Forward, 04/02/25
- Social Investing Increasing Liquidity for Private Co. Shares, 02/21/25
- Fund Giant BlackRock Is Out to Unite Public and Private Markets, 02/20/25
- “2025”, Year for Transformation to Private from Public Market Began, 02/18/25
- Blackstone Sees Trillions From Rich Flowing to Private Markets, 01/31/25
- Can Private Markets Be the Alternative to Lofty Public Market Valuations?, 01/30/25
- Corporate investors tap $30bn secondary market to exit startup holdings, 11/22/24
- Asset Managers Must Invest in Private Markets Now, Bain Says, 08/21/24
For access to all of the above articles and also to videos about the rapidly growing Privates asset class go to https://savechangeworld.com/private-markets/. For complimentary alerts for when new articles are published and recommended click here.
There are two keys for why the move into Privates has accelerated since the beginning of 2025:
- 2010 Dodd Frank Act
- Declining Asset Management fees
Dodd Frank Act
When the Dodd Frank Act was signed into law by President Obama in 2010, it resulted in the liability for investment professionals escalating from civil (arbitration) to criminal. Dodd Frank substantially:
-
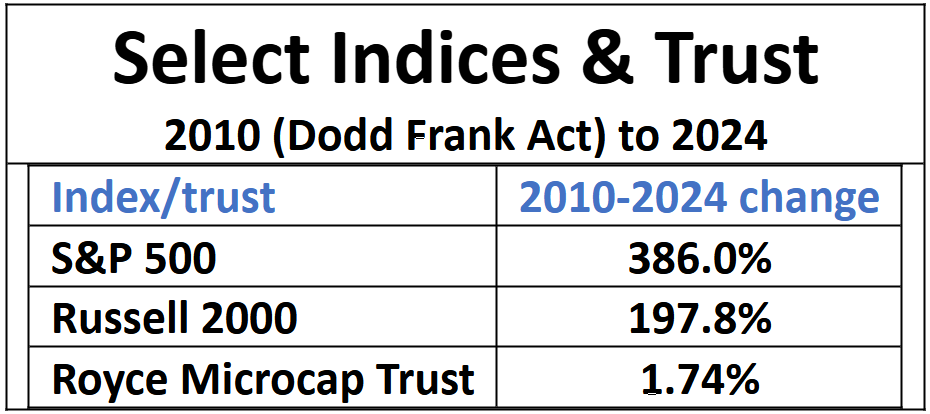
Reduced the valuations for small and medium sized publicly traded companies. The Act evaporated the demand by investment professionals to invest client monies into companies having less than a $20 billion market cap, the minimum requirement for a S&P 500-member company. This resulted in the smaller company indices, including the Russell 2000 and the Royce Microcap Trust, to significantly underperform the S&P since 2010. The Royce vehicle invests in companies with market caps of less than $500 million.
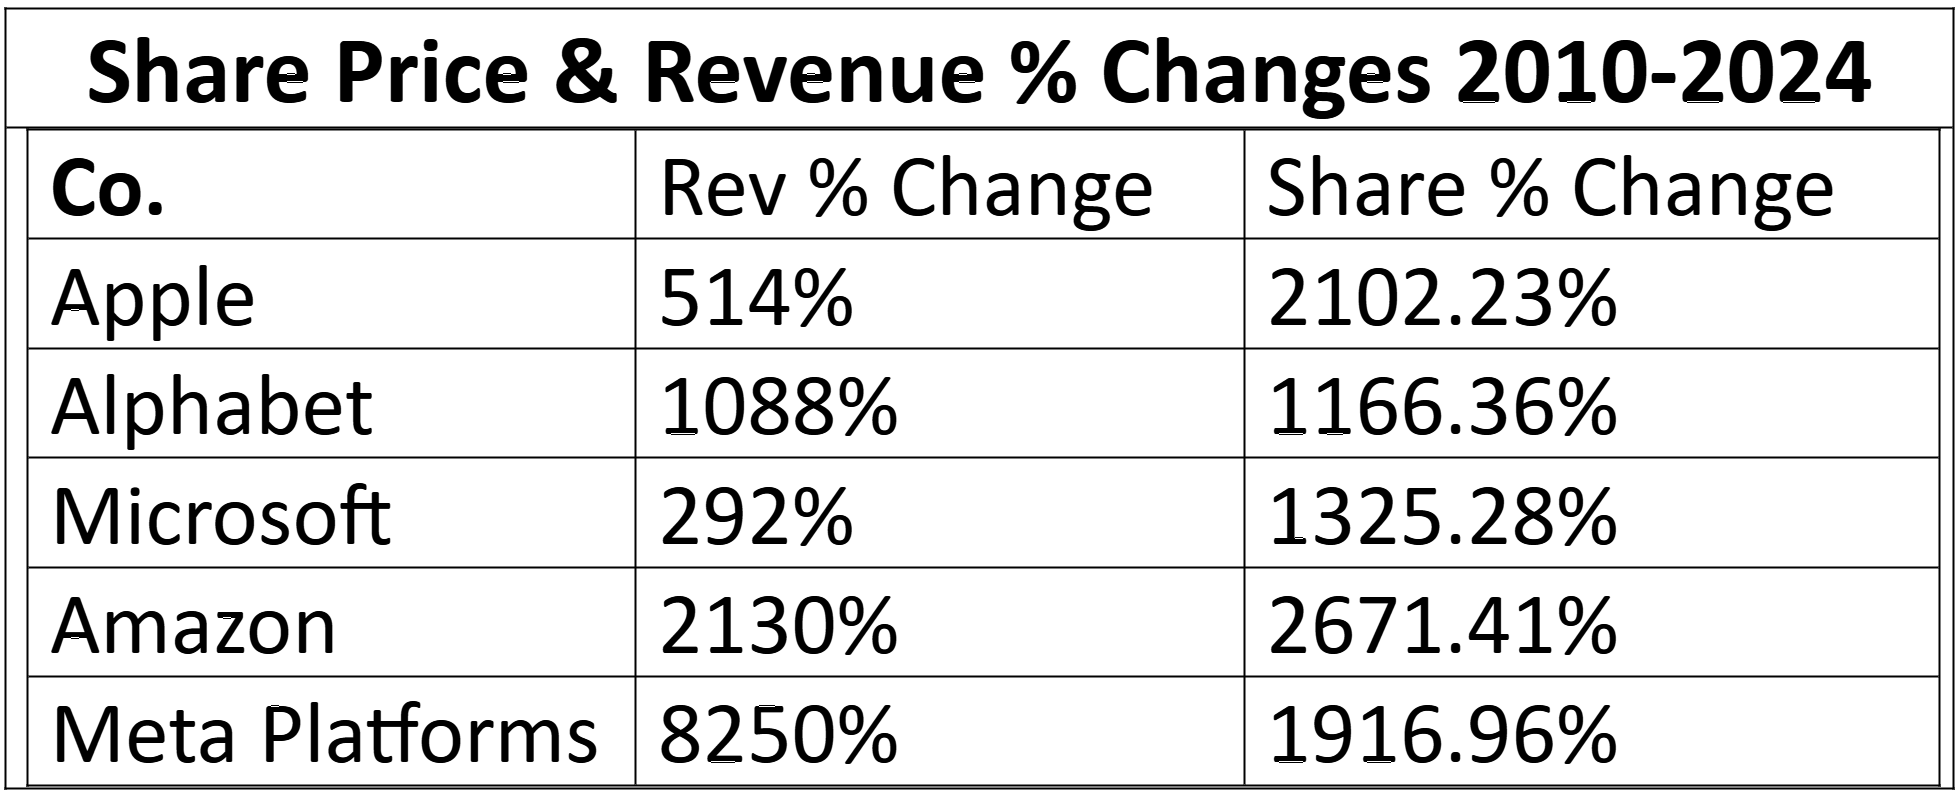
- Spiked the valuations for the largest companies. The Act substantially increased the demand by these same professional investors for the shares of Amazon, Microsoft, Apple, Alphabet and Meta Platforms. As of 4/30/25, these five companies had market caps or valuations which ranked among the six largest U.S. public companies. The five are also members of the Magnificent Seven.
The table below depicts the share price appreciation and revenue increases for the five companies from 2010 to 2024.
Please note. Meta Platforms was the only company in the above table that had revenue growth which was higher than share price appreciation. Typically, the percentage increase for a value of a business is based on the percentage increase for its revenue. Based on this simple law of math it can be argued that four of the five are significantly overvalued.
Very importantly, the five companies in the above table share a common denominator. They each have a business model which leverages the transformation of the global economy from industrial to digital. Access my 12/14/23 “3rd Transformation for Economy since 18th Century creating Dynasty Wealth building Opportunities” report and video about transformations for the economy since the 19th Century. The transformations have created rare opportunities for the savvy to create generational wealth. My 07/17/ 2024 report, “Nike & Lululemon, Precursors for S&P Decline to Multi-Year Low” provides the rationale for why the revenue growth rates for the five companies in the above table have a high probability to begin steady declines.
The 1,166% to 2,671% increases for the share prices and valuations of the companies in the above table resulted in the S&P 500 index increasing by 386.28%. This compared to 304.76% increase for a portfolio containing all of its 500 members from 2010 to 2024. The difference is because the S&P 500 is a market cap weighted index. Market cap weighted means that the performance of the larger companies in an index account for a majority of the index’s performance metrics. If an index’s largest companies outperform the rest of its companies the index can and will outperform a portfolio which has an equal amount in each of the index’s member companies.
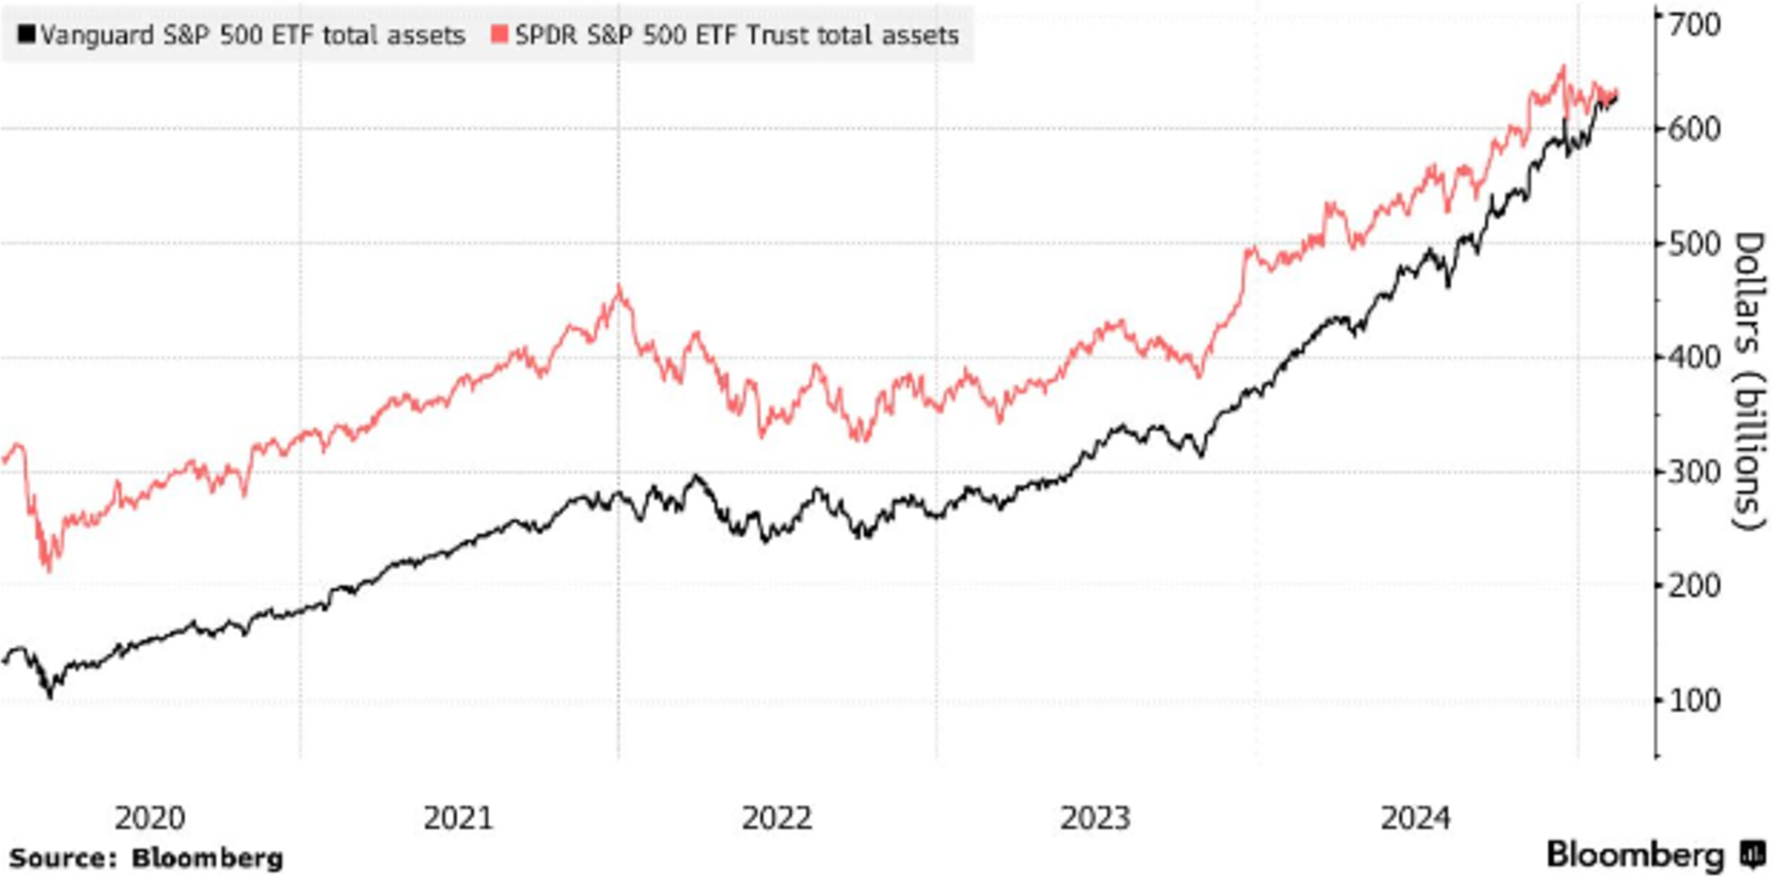
The S&P 500’s market cap weighting calculation enabled two exchanged traded funds managed by Vanguard (VOO) and State Street (SPDR:SPY) to consistently outperform a portfolio containing equal portions in all of the index’s members. The advantage that the ETFs had versus a portfolio containing all of the S&P’s 500 members enabled them to become capital attracting magnets. The chart below depicts the expansion of assets for the two ETFs from less than an aggregate of $500 billion in 2020 to a most recent $1.3 trillion.
The significant increase in cash for the ETFs resulted in the valuations for the five companies in the above table along with NVIDIA and Tesla, the two members remaining of the seven Magnificent Seven, to become excessive.
Declining Asset Management Fees
The above chart which depicts an aggregate of $1.3 Trillion of assets for the State Street and Vanguard ETFs is from Bloomberg article “Vanguard Overtakes State Street as World’s Biggest ETF”. The paragraph below is an excerpt from same article.
“It’s a sign of the cost-conscious times. SPY charges 0.095% per year to track the S&P 500, compared to VOO’s fee of just 0.03% to follow the same index. As low-cost ETFs have become the vehicle of choice for many in the buy-and-hold crowd, that’s massively benefitted the likes of Vanguard: VOO has yet to post a net annual outflow.”
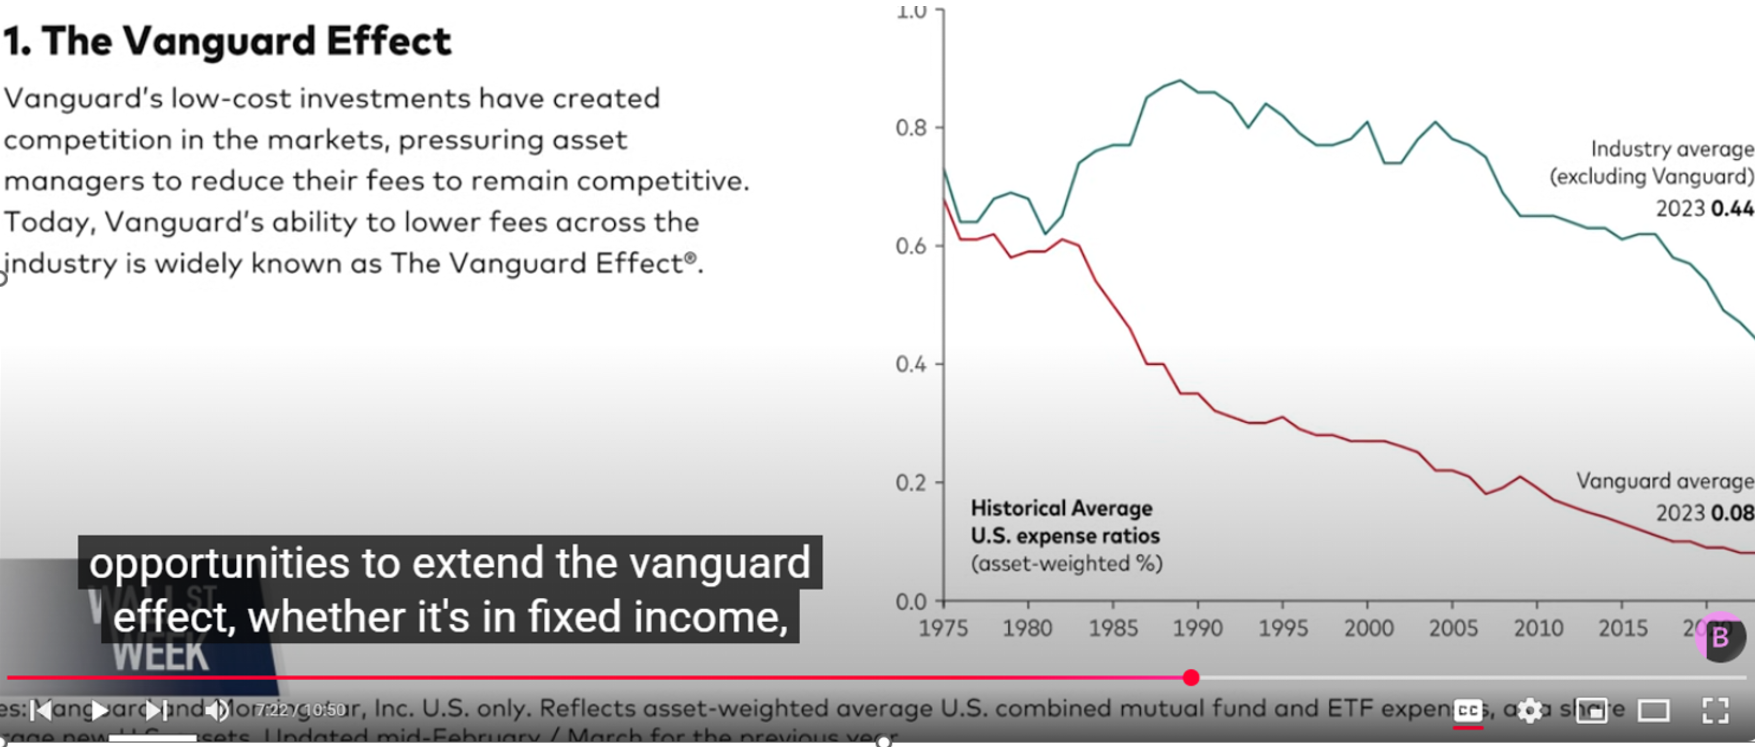
The chart below is from Bloomberg’s 05/02/25 “Wall Street Week” which aired on Bloomberg television and YouTube. The most recent episode for the weekly program included an interview of Vanguard’s CEO. He explained Vanguard’s practice of substantially reducing its asset management fees which is widely known in the asset management industry as the “Vanguard Effect”. View CEO interview clip “Reduced ETF Fees Driving Vanguard & Competitors into Private Market”.
The Vanguard CEO also divulged that the behemoth investment management company had established a partnership with Wellington for entry into the managed private assets market.
Vanguard’s primary S&P 500 ETF competitor State Street, which manages the SPDR (symbol:SPY), announced that its also entering into the private assets managed business with Carlyle as its partner. See “Carlyle, State Street Mull Partnership to Tap Retail Wealth”.
All of the US’ other major alternative assets managers including Blackstone, Apollo, KKR and Blackrock have announced their plans to enter into the private assets management market. A February 2025, Bloomberg article “Fund Giant BlackRock Is Out to Unite Public and Private Markets” explained that BlackRock could increase its management fee 10 fold from managing non-public or private assets versus publicly traded assets.
From what has been published from August of 2024 through May of 2025 the asset management industry is doing everything it can to educate advisors and investors about the emerging Privates asset class. It’s the only viable alternative for growth investing for the aforementioned reasons and has lower risk than publicly traded assets.
The world’s largest asset managers have concluded the following:
- The five largest companies in the world powered the steady increases for the S&P 500 ETFs from 2010 to 2024. The same companies from 2024 to 2038 are unlikely to repeat their recent 14-year revenue growth rates. Its due to the sheer sizes of their revenue bases. The probability that there will ever be five companies that coexist at any point in the future to mimic the percentage increases for revenue and valuations within a 14-year period is extremely low.
-
The outperformance of the SPY and VOO ETFs versus a portfolio containing equal amounts in the 500 S&P members is only because the ETFs mimicked the performance of the S&P 500 index instead of its members. Even worse, because of the S&P 500’s math and holdings of Magnificent Seven members, the index in the future is likely to underperform a portfolio containing its 500 members.
-
The most significant index in the world underperforming and in steady decline would cast a pall over the entire world’s stock market. All publicly traded shares would come under pressure. Investor sentiment and consumer confidence throughout the world would plummet.
-
The fees for managing publicly traded assets have been and will continue to steadily decline. The fees from managing private versus public assets are exponentially higher.
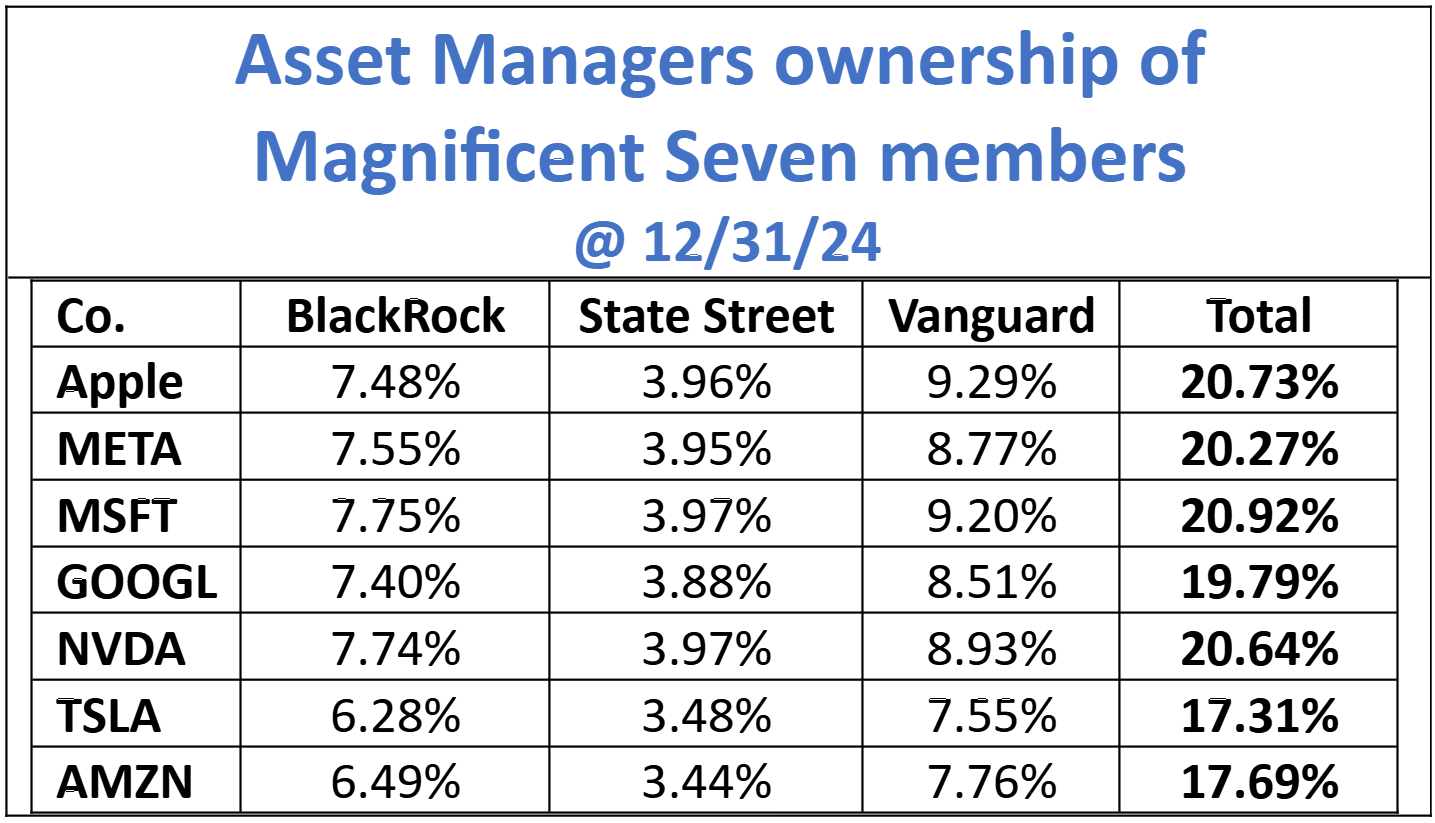
Based on the two above conclusions the asset managers in the table below have likely been and will continue to be steady sellers of the seven members of the Magnificent Seven. The selling of an aggregate of 17.31% and 20.92% of the shares outstanding of each of the companies by asset managers will cause their shares to steadily decline.
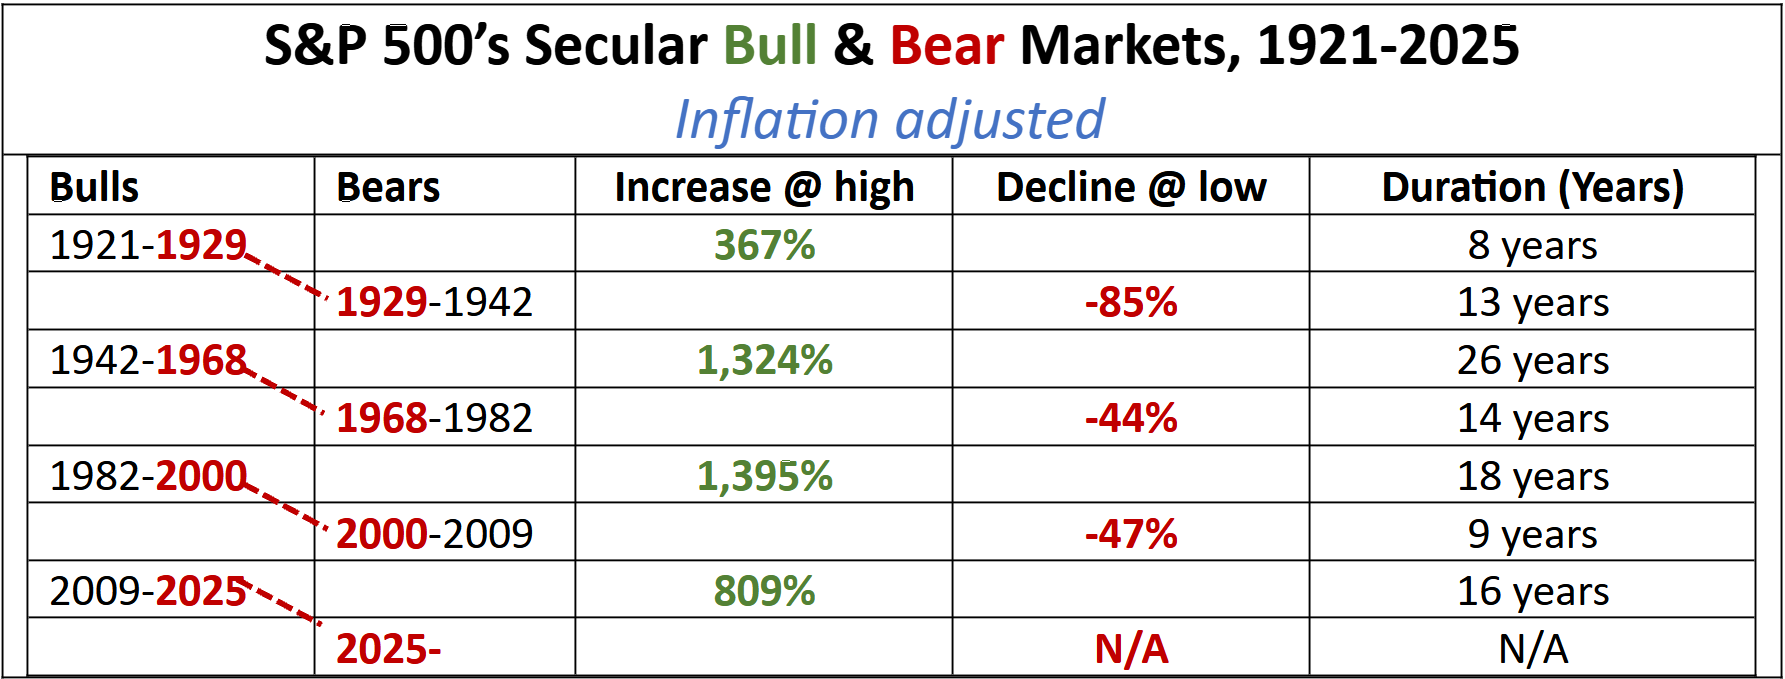
This research update confirms that the S&P 500 entered into a secular bear market in February of 2025. The decline for the index is projected to be a minimum of 47%. The probability for a decline of 80% has increased substantially. The secular bear now underway is projected to not end prior to 2034 based on the durations of the prior secular bears in the table below.
To obtain a better understanding about a secular bear and the difference between it and a cyclical bear see 03/17/25 “Secular Bear Underway, How 80%+ Decline for Dow & S&P Possible?”
Conversely, the Privates asset class has entered a period of extended secular growth. Because of the much higher management fees the new asset class will likely never experience a secular downtrend or bear. The Privates class replaces a public market which became antiquated due to Dodd Frank. For the future a bifurcated secondary market for equities consisting of the following is predicted:
-
Private market for private companies valued for less than $10 billion.
-
Public market for public companies with minimum valuations of $10 billion
My prediction is also that publicly traded companies, valued for less than $10 billion, will become extinct. Finally, the bifurcated market could eventually eliminate secular bear markets for publicly traded companies altogether.
Dynasty Wealth, which I co-founded, is on the leading edge of the public to Privates transformation. To understand why read “Dynasty Wealth on forefront of public to private market transformation“.
For the present my recommendation is for the shares of the members of the Magnificent Seven and for all blue-chips and mutual funds to be sold. The proceeds can be utilized to deploy a defensive growth strategy. The strategy enables a portfolio to grow during a secular bear or bull market. The table below depicts that $100,000 deployed into a portfolio utilizing the strategy is projected to increase to $1,742,000 by 2034. The video about the strategy is highly recommended.
Defensive Growth Strategy Explained

Register to attend the “Markowski on the Markets” (MOTM)
Saturday 11:30AM EST Weekly ZOOM Sessions.
Updates & timely info pertaining to just concluded trading week including:
─ Coverage of the extreme market and economic events that are discovered and analyzed
─ Analyses of S&P 500 divergences and technicals
─ Pertinent news for U.S. & Global Economy
─ Companies listed on SaveChangeWorld.com that qualify for inclusion in a defensive growth portfolio
- Publicly traded micro-caps with 10X upside potential
- Private startup and early stage with 100X upside potential

Michael Markowski, Director of Research for SaveChangeWorld.com. Developer of “Defensive Growth Strategy”. Entered markets with Merrill Lynch in 1977. Named “Top 50 Investor” by Fortune Magazine. Formerly, underwriter of venture stage IPOs, including one acquired by United Health Care for 1700% gain. Since 2002 has conducted empirical research to develop algorithms which predict the negative and positive extremes for the market and stocks. Has verifiable track records for predicting (1) bankruptcies of blue chips, (2) market crashes and (3) stocks multiplying by 10X. In a 2007 Equities Magazine article predicted the epic collapses for Lehman, Bear Stearns and Merrill Lynch. Most recent algorithm developed from research of UBER and AirBnB has enabled identification of startups having 100X upside potential within 7 to 10 years. Video (3 minutes, 53 seconds) covers Mr. Markowski’s research to develop predictive algorithm methodology.

