
The 2026 highs for the vast majority of all stocks are not likely to be exceeded until 2051. The prediction is based on my research of the Dow Jones Index from 1802 to 2009. The research enabled my discovering that stocks have secular bull and bear market patterns. Throughout their history, stocks have exhibited long term (secular) behavioral patterns. The stock market since its inception has a well established pattern of climbing for a minimum of eight to a maximum of 20 years. It then reverses and declines for eight to 20 years.
History says that
- A secular bear market with a decline of 49% to 93% from the 2026 high to the eventual low has already begun or will soon begin. A secular is much different than a cyclical pattern, which can have durations ranging from a few months to a few years. Cyclical patterns can and have always occurred within secular patterns.
- Investors should expect the Dow Jones and S&P 500 indices to steadily decline for eight to 20 years, and to the point, at which the bottom is reached. History also says that 2026 high for 2009 to 2026 secular bull, may not be exceeded until 2051. Vanguard, which is among the world’s largest asset managers, has predicted much lower annual returns for stocks for next 10 years versus last 10 years.
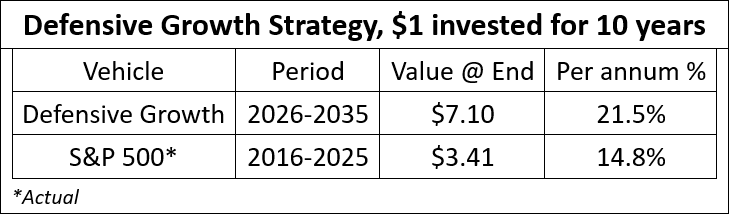
My recommendation is for all investors, and especially those with 100 year time horizons, to effectuate a Defensive Growth strategy. $1.0 million in the strategy, developed from the extensive research for the performance history of all non-correlated or alternative asset classes by AlphaTack.com, is projected to increase to $7.1 million, an annualized 21.5% through 2035. For the last ten years the same amount to buy and hold the S&P 500 index increased to $3.4 million, average of 14.8% per annum.
A fund is currently under construction to deploy AlphaTack’s Defensive Growth strategy. It is projected to be available by October 1, 2026. To be alerted when fund is available click here to register. Video below covers AlphaTack’s defensive growth strategy.
AlphaTack DGIC Overview

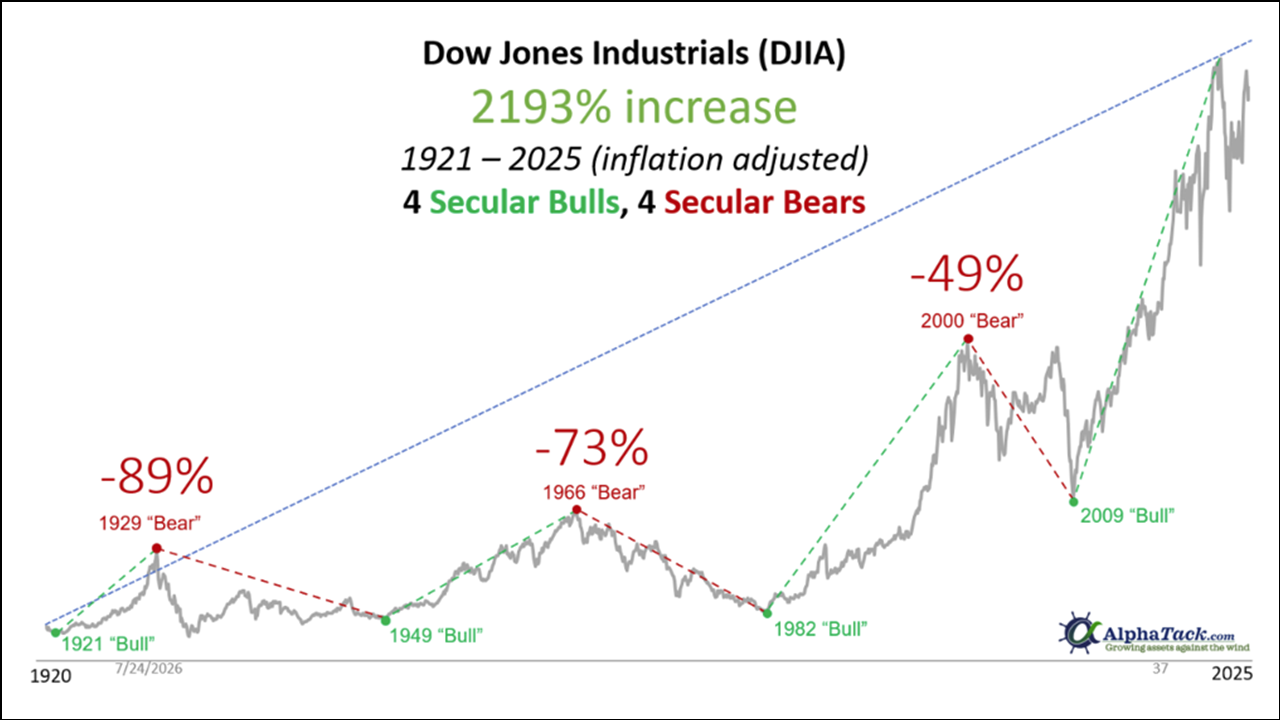
The chart below, which covers 1920 to 2025, depicts the secular nature of the Dow Jones Industrials index. The index is more than 50 years older than the S&P 500, which is the world’s largest stock market index. The S&P 500, though younger, has a similar secular pattern.
Those who bought in 1920 and held shares of all of the Dow’s 30 member companies through the end of 2025, had a gain of 2,193%. However, holders had to endure pain. There were three nine to 20 year interim periods, that began in 1929, 1966 and 2000, for which the Dow had declines ranging from 49% to 89%.
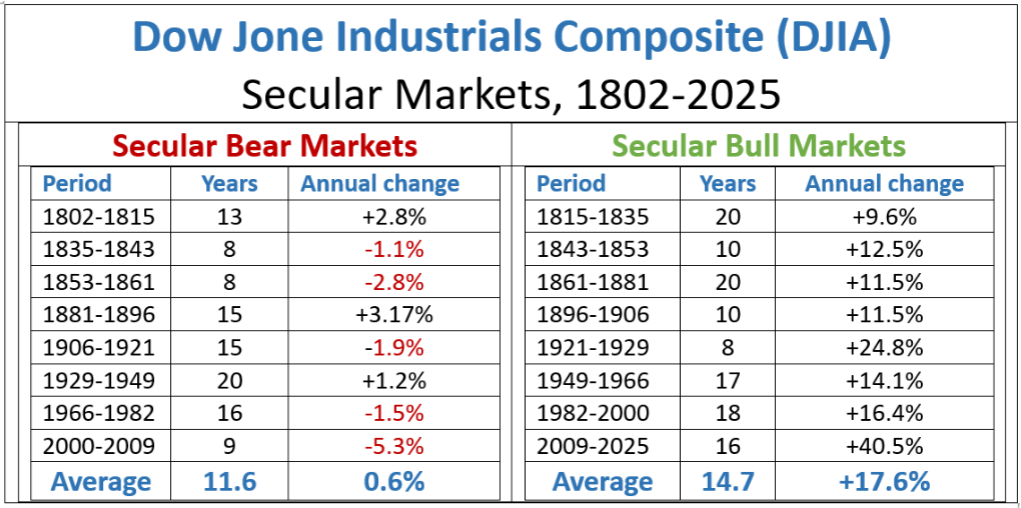
The table below contains the durations and the average per annum gains and losses for the Dow from 1802 to 2025. The table depicts that the minimum duration for secular bulls and bears is eight years.
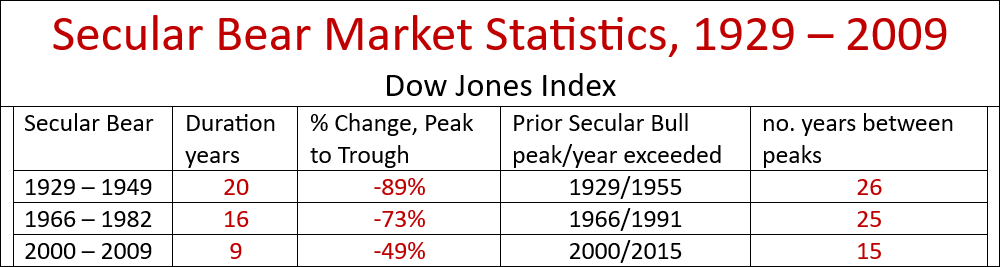
The table below depicts even more pain for those who followed a passive buy and hold strategy. The number of years required for the Dow to climb back to its prior secular bull peak was more than 30% longer than the durations for all of the prior secular bear markets. It’s quite conceivable that the peak, which may have already or will soon occur, based on the statistics for all prior secular markets may not be exceeded until 2051.
The current 17 years old 2009 to 2026 bull is tied with the 1949 to 1966 secular bull for having the second longest duration for the modern era (20th and 21st Centuries). The probability for the current bull, that began in 2009, to be extended for another year or two is statistically very low.
The stock market’s secularity is organic. For a secular high to be reached requires many years for the vast majority of all investors to believe that a steadily increasing stock market will continue to increase. Conversely, a vast majority of all investors believing that the market will continue to decline is required for a secular bottom to be reached.
There are numerous other seasoned and professional investors who are predicting a significant and steady decline for the S&P 500 for the next 10 to 20 years. Vanguard, which has $11 Trillion of assets under management, issued a warning in late 2025. In their report they projected annualized gains of 3.5 to 5.5% for the S&P 500 through 2034:
The returns that Vanguard is predicting are in line with the three prior secular bears, which produced low single digit returns. The last secular bear that was profitable began in 1929. It produced an average annualized gain of 1.2% through 1949.
Another investor, who is predicting an extended decline, is Jim Chanos. He is considered to be the foremost short seller. I recently recommended a view of Mr. Chanos’ most recent interview:
“Interview of Iconic Short Seller Chanos, Great for a SUMMER Sunday”
The above reports and videos are available at AlphaTack.com.
The big question is, will the incoming secular bear have a short eight year duration or will it have a 20 year duration?
The duration for a secular market is based on the number of significant positive and negative developments or themes that can occur during the lifespan of a bull or bear respectively. For example, the onset of World War II in 1939 extended the life of the secular bear market which began in 1929. The ending of the war and the baby boom that followed powered the 1949 to 1966 secular bull. The bursting of the dotcom bubble in 2000 and the mortgage crisis that culminated with the 2008 collapses of the five brokers including Lehman, which I had predicted in a September 2007, Equities Magazine article, powered the 2000 to 2009 secular bear. The table below contains all of my media verifiable market correction predictions since 2007.

The table below contains the five themes which could each separately extend the lifespan of the next secular bear market to 20 or more years.
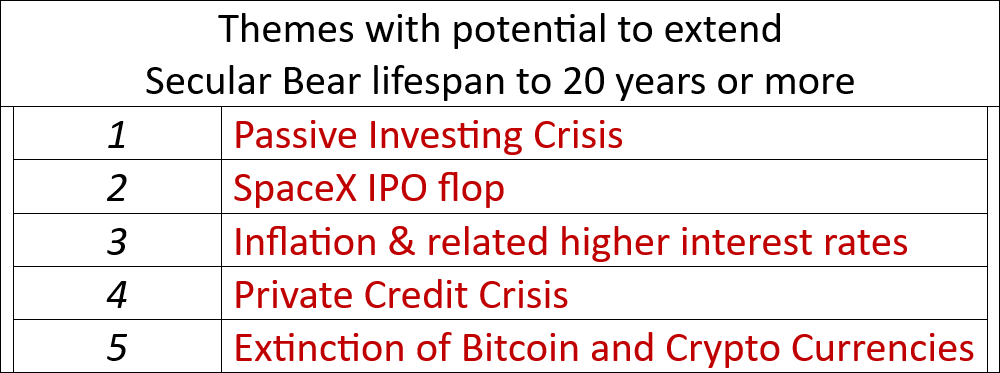
The themes and the status of each named in the above table are covered in the weekly Markowski on the Markets sessions which are held each Saturday morning at 11:30AM EST in United States. To participate and to receive the ZOOM link to the complimentary sessions click below to register:
The theme that will likely be the culprit for a 20 year Secular Bear is Passive Investing
The incoming secular bear shares a common, and however ironic, denominator with the 1929 to 1949 secular bear, which has the longest duration of 20 years. The brutal bear was preceded by the roaring twenties secular bull, which was powered by excessive fraud and speculation. There were no securities regulations whatsoever. It was not uncommon back then for one to purchase shares in their favorite restaurant or bar.
In the aftermath of the 1929 crash, The U.S. Securities & Exchange Commission (SEC) was formed in 1934. The new government regulator created and enforced the laws pertaining to the issuance and sales of securities. The laws drastically reduced the speculative activity that had powered stocks to exorbitant highs in 1929. Yale economist Irving Fisher became famous for predicting, on October 15, 1929, that “stock prices have reached what looks like a permanently high plateau.” Nine days later, the infamous Wall Street Crash of 1929 occurred.
The 24% annualized increase for the secular bull from 1921 to 1929, ranks only second to the current 2009 to 2026 secular bulls’ 40.5% annualized return. The significant and steady gains through 1929 had fueled risk taking, which had in turn juiced the US economy. The formation of the SEC put a damper on all speculative activities. That and the significant change in investor behavior to risk avoidance were perhaps the key reasons for why the US economy rolled into a depression from a recession.
Ironically, the infamous crash of 2008, was the catalyst, which will likely be the cause of a 20 year or more secular bear and a significant US and global economic depression. The 2008 crash, which occurred just prior to the end of the 2000 to 2009 secular bear market, resulted in the passage of the Dodd Frank Act in 2010.
Dodd Frank, which went into effect in 2014, significantly altered the US capital markets. It increased the liability for brokers and asset managers to criminal from civil. Shortly after the SEC had been formed in 1934 a licensing process for brokers was created. Arbitration was also implemented to enable a client to have recourse against licensed financial professionals who lost them money. The professionals who had civil liability were stock brokers and advisors. From 1934 to 2014 when Dodd Frank become enforced a financial professional’s liability had been civil.
Dodd Frank resulted in the following:
- Extinction of the stock broker which was replaced by the wealth manager
- Clients no longer paying a commission, but instead a percentage of assets managed fee
- Financial professionals no longer willing to purchase a single stock for a client to limit the potential for them to be criminally prosecuted.
- Financial professionals opting to invest the assets of their clients in exchange traded index funds (ETFs) that mimic the performance of the S&P 500.
In 2014 the transformation from active to passive investing began in earnest. The stock brokers, who had been conducting the research to find the new and upcoming small companies since the 1930s disappeared. The safest and easiest solution for a professional asset manager became the investing of client monies into index funds and specifically, the S&P 500 SPDR or SPY.
The transformation to invest in passive funds, which mimic an index is instead of stocks, after Dodd Frank included the criminal liability provision, created an inherent and growing mathematical flaw for investing. The result was a substantial reduction for number of active professional investors and the amounts that thy manage. The change for the capital markets since Dodd have been sweeping. The changes caused the comparable valuation metrics including PE and PS ratios for the much larger companies having slower and slower revenue and earnings growth due to large number dynamics to increase versus the historical metrics. Conversely, the metrics for the smaller and much faster growing companies compressed. The chart below illustrates the flaw. It compares the performance of the tiny companies in the Royce Microcap mutual fund versus the S&P 500. The Royce Microcap fund outperformed the S&P 500 prior to Dodd Frank. Since Dodd Frank was enacted the fund which contains smaller companies, which have the potential grow much faster due to the law of small numbers, to underperform the S&P 500.
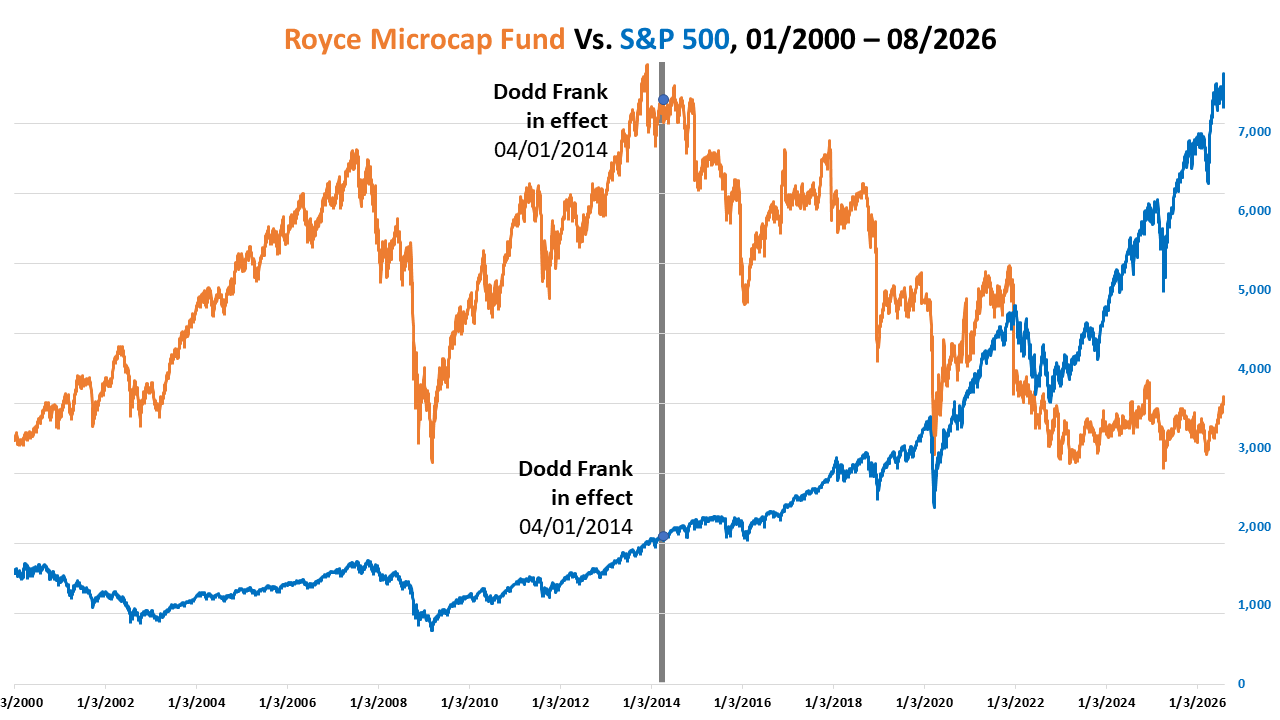
Prior to the passage of Dodd Frank the shares of smaller companies had historically outperformed larger company shares. My 1984 research of 250 companies in 1984 that had multiplied by a median 19 times from 1974 to 1983 confirms the flaw. The findings from my research concluded that there was a direct correlation between revenue growth and stock price appreciation. The table below shows the strong correlation between revenue growth and share price appreciation.
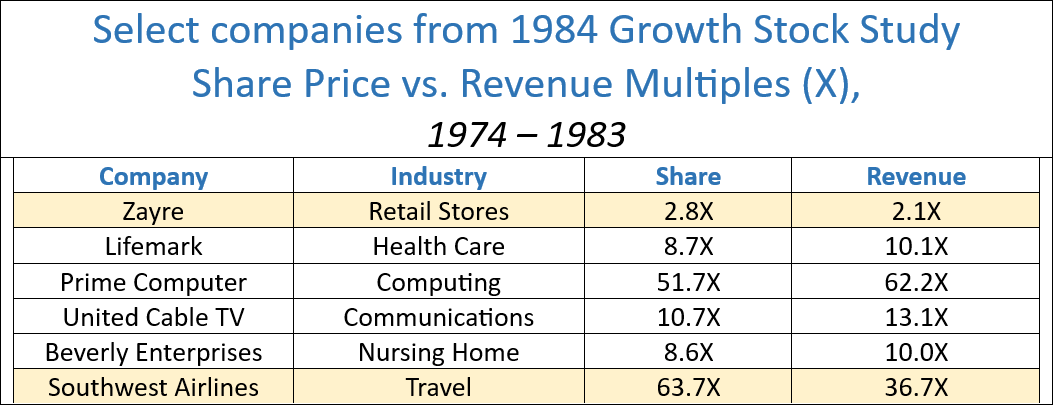
The table above also depicts that only two of the companies, Zayre and Southwest Airlines had higher share price multiple increases as compared to revenue. The table below depicts that all of the members of the Magnificent 7 had share price multiples that were greater than revenue multiples from 2016 to 2025.
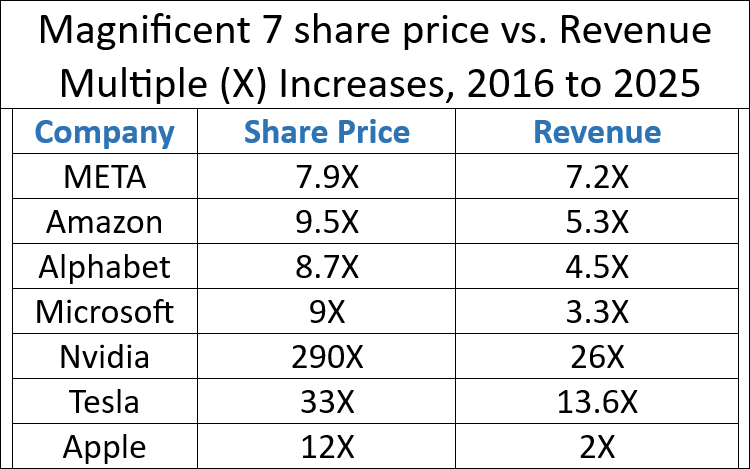
Dodd Frank created, what will likely remain as, a permanent inefficiency for the capital markets. The largest and slowest growing companies are relatively over valued compared to smaller companies which have a sheer math advantage.
Dodd Frank also has permanently changed investing to passive from active. Dodd Frank forces managed assets from active managers into the passive ETFs. The active manager has criminal liability while the passive does not. It’s just that simple.
The new monies flowing into the index ETFs including the SPDR (symbol:SPY) automatically acquire the shares of the companies that the ETF holds. The monies for the SPY are allocated and based on the each of the member companies, weightings for the S&P 500 Index. Via the existing method the majority of all of the new monies flow into the S&P 500,000’ largest companies which include the members of the Magnificent 7.
Analyst Michael Green, whom I follow, is the foremost expert on the passive investing risk. His interview “Mike Green: Passive investing is approaching dangerous levels” by ETF Stream is highly recommended. The key take aways by ETF Stream from the interview:
- The rise of passive investing has increased stock market concentration because the biggest stocks have the lowest liquidity relative to their size
- This has caused market cap-weighted strategies to outperform, attracting more inflows, driving even more extreme concentration
- However, if the rise of passive investing continues at its current rate the stock market will become susceptible to a crash
The math is very simple. As time goes on there will eventually be fewer and fewer institutional investors left to purchase shares in the companies held by the ETFs. When that happens there will no floor below the share prices of the companies held by the ETF. Therefore, the prices of the shares of the ETF will then crash. A good example is the Korean stock market. Since the beginning of 2026, the Korean stock market which is also loaded with passive index funds and ETFs has experienced numerous trading halts. See:
- “Korean Stocks See Record Wave of Trading Halts on Chip Selloff”, July 29, 2026
- South Korea’s Leveraged ETF Trading Plummets Under New Curbs, August 4, 2026
For more on the huge passive investing risk see:
- Leveraged ETFs Need to Be Reined In, August 3, 2026
- Fund Launches and Leveraged ETFs Flood The Industry | ETF IQ 8/3/2026, August 3, 2026
Therefore, Passive Investing is the greatest reason for why the secular bear that has begun or will soon begin has the potential to have duration of 20 years or more. As happened after 1929 and 2008, and after the passive funds cause their crash, the regulators will step in to create a new law to eliminate passive ETFs. Upon that happening there will be an entire generation of professional wealth managers and and retail investors who have no experience with investing in individual companies.
To summarize, history is likely to repeat. The speculative activities that led to the crash of 1929, resulted in the regulatory repercussions, which powered the Great Depression and the 1929 to 1949 secular bear market. The regulatory repercussions from the crash of 2008:
- Resulted in the most powerful secular bull (2009-2025) throughout the history of the US stock market. The annualized gain at the end of the 2025 was 40.5%. The current secular bull’s gain is almost double the second place 1920 to 1929 secular bull at 24.8%.
- Will most probably result in the secular bear, which has already or will soon begin, vying for the longest duration and most severe decline as compared to all prior secular bears.
Finally, to reiterate, my recommendation is for all investors to effectuate a Defensive Growth strategy. $1.0 million in the strategy, developed from the extensive research for the performance history of all non-correlated or alternative asset classes by AlphaTack.com, is projected to increase to $7.1 million, an annualized 21.5% through 2035. For the last ten years the same amount to buy and hold the S&P 500 index increased to $3.4 million, average of 14.8% per annum.
A fund is currently under construction to deploy AlphaTack’s Defensive Growth strategy. It is projected to be available by October 1, 2026. To be alerted when fund is available click here to register. Click here for access to video about AlphaTack and its defensive growth strategy.

Michael Markowski, Director of Research for AlphaTack.com. Developer of “Defensive Growth Strategy”. Entered markets with Merrill Lynch in 1977. Named “Top 50 Investor” by Fortune Magazine. Formerly, underwriter of venture stage IPOs, including one acquired by United Health Care for 1700% gain. Since 2002 has conducted empirical research to develop algorithms which predict the negative and positive extremes for the market and stocks. Has verifiable track records for predicting (1) bankruptcies of blue chips, (2) market crashes and (3) stocks multiplying by 10X. In a 2007 Equities Magazine article predicted the epic collapses for Lehman, Bear Stearns and Merrill Lynch. Most recent algorithm developed from research of UBER and AirBnB has enabled identification of startups having 100X upside potential within 7 to 10 years.