The U.S. economy and Corporate America are in serious trouble, because the Trailing 12 Months (TTM) operating cash flows for the S&P 500’s five largest companies are in decline. Additional research was conducted on the S&P 500’s remaining 95 out of its 100 largest member companies for their most recent reporting period. In total, there were 54 of S&P 500’s largest 100 companies that had operating cash flow declines for their most recent reporting period compared to a prior fiscal year’s operating cash flow peak, dating back to fiscal 2019.
Analysts, economists and financial media have it all wrong. Their primary focus has been to monitor consumer spending and inflation. Declining operating cash flows for behemoth companies indicate that a substantial slowdown for the U.S. economy will soon be underway. When the largest and most credible companies are having difficulties increasing their operating cash flow, the probability is high that many smaller companies and businesses will soon shed blood. The day of reckoning is looming for the U.S. economy and stock market.
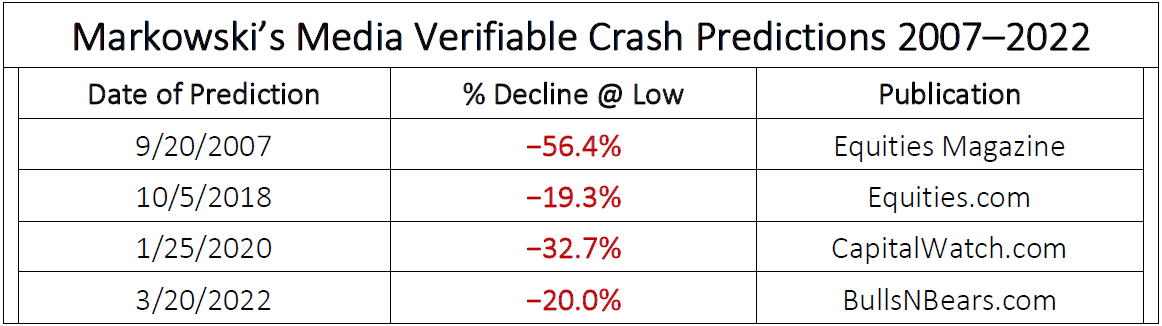
My September 2007 warning to readers of Equities Magazine to sell all of their holdings in Lehman, Bear Stearns and Merrill Lynch was based on my analysis of the brokers’ operating cash flow. The subsequent September 2008 collapses in shares of the five brokerage firms named in my 2007 article were the catalysts that induced the Great Recession of 2008.
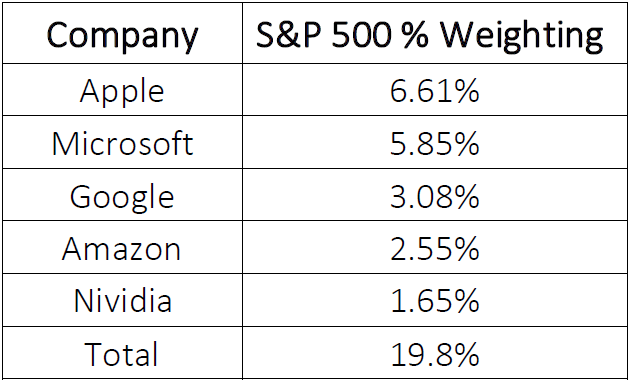
The table below depicts the S&P 500’s five largest market cap-weighted companies. TTM operating cash flow for all of the companies, exception Amazon declined vs. their prior comparable periods. Amazon made the list because its operating cash flow was 29.2% lower than its peak operating cash flow for fiscal 2020 when its operating cash flow reached its all-time high. Amazon also generated negative FREE CASH flow for its most recent 12 months.
The declining operating cash flow for the companies in the above table is significant. All of them had winning streaks for increasing their operating cash flow for consecutive fiscal years from 2016 through 2020 or 2021. The break in consistency of a company that had been able to steadily increase its operating cash flow is the signal that its overall health ― including revenue and profits ― will soon begin to decline. Because the five companies’ represent 19.8% of the S&P 500’s market capitalization it is all but guaranteed that the index will decline to below its 2022 lows during 2023.
My findings of widespread declines of operating cash flow support my June 2022 predictions below. They were based on my extensive research of: i) the negative effect that inflation had on the S&P 500 from 1871 to 2020; and ii), the Federal Reserve’s discount rate changes from its inception in 1913.
Operating cash flow is a leading indicator for the health of a corporation and in aggregate is a leading indicator for an industry or an economy. It is a leading indicator because changes in operating cash flow are calculated from the decreases or increases in assets or liabilities when compared to a prior period. The two primary financial statement metrics or culprits that contribute to a decline in CFFO are increasing inventories and accounts receivable. Both coincide with a contracting economy. Examples follow:
Declining operating cash flow negatively impacts a company, industry or economy because the cash that is available for capital expenditures is reduced or eliminated. This results in the company having to borrow to purchase needed equipment or to delay the purchase of equipment, etc. Thus, declining operating cash flow decreases capital spending.
Note: My June 2022 prediction for the U.S. to enter its 3rd Great Depression by end of 2023 was based on several events and coinciding ingredients, including a decline in capital spending. One of the primary ingredients is a decline in capital spending. To learn more about all of the contributing ingredients and how an economic depression can occur click here to view the video of my Entrenched Inflation presentation.
On February 14, 2023, the 25 blue chip U.S. companies in the table below had an aggregate market cap of $11.7. Weighting of this group is equivalent to 32% of the S&P 500’s market cap.. The table depicts all reported annualized Operating Cash Flow (OCF) declines by as much as 71.7% from their 2019 to 2022 annualized operating cash flow peaks. All also reported declines in their Free Cash Flow (FCF) for their latest 12 months when compared to their annualized peaks from 2019 to 2022. A decline in Free Cash Flow is also significant since free cash is utilized for the payment of a cash dividend.
My research methodology was to identify a corporation’s peak fiscal year for operating cash flow from its 2019, 2020, 2021 and 2022 fiscal years. Identifying the peak fiscal year for operating cash flow established a baseline. The OCF metric could then be utilized to compare a company’s operating cash flow for its most recent 12 months (TTM). Results were, and will continue to be, utilized to diagnose the financial health of each business.
The 25 companies listed in the table above include 15 members of the Dow Jones 30 Industrials Composite that had lower operating cash flow for their latest trailing 12 month periods when compared to a prior fiscal year operating cash flow peak. The six members of the FANGAM index in the table below are also included in the above table. FANGAM was created for my October 2018 article entitled, “Day of Reckoning Approaching for Market” which included my prediction that a market crash was imminent. See PRlog: “Visionary Market Analyst Michael Markowski Predicted the third largest drop in Dow’s history”. October 17. 2018.
The FANGAM Index contains the five original FAANG members, plus Microsoft.
Because Microsoft and Alphabet were ranked the 24th and 25th worst for annualized operating cash flow declines in the rankings table above, an argument could be made that their operating cash flow declines were irrelevant. However, their inabilities to increase their annualized OCF spoke volumes. The bar chart below depicts that Microsoft had increased its operating cash flow for six consecutive years and Alphabet for five consecutive years dating back to 2017. Thus, the declines that occurred after five or more years of consecutive annual operating cash flow increases were monumental for both companies. Finally, Alphabet’s annual Free Cash Flow declined by 10.5% and Microsoft’s by 8.5% for their latest 12 months.
Additionally, the bar chart for the FANGAM index below is further confirmation that OCF and the Free Cash Flow for the six members has peaked. The probability is high that steady increases in for revenue earnings and operating cash flow have ended for most (if not all) of FANGAM’s members.
The aggregate market cap-weighting was 45.1% for the 61 companies with declining operating cash flow discussed in this report. The weighting includes the 25 companies ranked in this report. It also includes the S&P 500’s 36 companies with declining operating cash flow. (These companies that are among the S&P’s 100 largest are not ranked in this report.)
Because this report contains a significant number of large companies across multiple industries it is not only a proxy for this economy, it also typifies the direction of the S&P 500 and Dow Jones 30 Industrials composite indices. Therefore, the probability is exceedingly high for the following occurrences:
From my expertise and extensive experience in analyzing operating cash flow, there exists a high correlation between the direction of operating cash flow and earnings or net income. Increases in operating cash flow for a business are followed by increases in net income. Decreases in operating cash flow are followed by decreases in net income, or losses. Therefore, operating cash flow is a leading indicator of future increases or decreases in net income. Articles related to my expertise in Operating Cash Flow analyses follow:
Because operating cash flow is declining for a majority of the S&P 500 companies, the companies will not be able to meet the Wall Street analysts’ earnings estimates. When their earnings estimates are missed, the price of the underlying shares will decline. Therefore, the deterioration of these fundamentals currently underway will result in a significant decline for the S&P 500 to a 2023 low, below that of the 2022 low.
The declining operating cash flow findings fully support the following predictions that I made in June of 2022:
The S&P 500 prediction was based on the findings from my research of inflation and how it affected the valuations for the S&P 500 from 1871–2021. My prediction of a “Great Depression” was based on my research of all of the U.S. Federal Reserve discount rate changes since the bank’s inception in 1913. The articles below include my research findings and are highly recommended.
Viewing is highly recommended for video entitled, Entrenched Inflation that captured my September 2022 presentation at an event held in New York City for family offices (private wealth management advisory firms) that serve ultra-high-net-worth individuals). The video covers both of the above predictions.
The table below depicts my crash predictions from 2007 to 2022. Links to the articles are available at www.alphatack.com.
Finally, my recommended “Return of Capital” defensive strategy that should be deployed by all investors is incorporated in the “Entrenched Inflation” video recommended earlier in this article. For additional reports and videos that support my predictions go to AlphaTack.com whose slogan is “Growing Assets Against the Wind”.
Michael Markowski, a 47-year financial markets veteran, is the Director of Strategies for AlphaTack, whose slogan is “growing assets against the wind”. He conducts empirical research of the past, which he then utilizes to develop algorithms to predict the future. His research of Enron’s Financial Statements after its infamous bankruptcy led to the development of a Cash Flow Statement algorithm. The algorithm was utilized to predict a “day of reckoning” for Lehman, Bear Stearns, Merrill Lynch, Morgan Stanley and Goldman Sachs in a September 2007, Equities Magazine article. Michael’s research of prior market crashes led to the development of the Bull & Bear Tracker (BBT) algorithm. From 2018 to 2022, the BBT gained 177% vs. the S&P 500’s 50%. His predictions of all periods of heightened market volatility from 2008 to 2022 and that S&P 500 at March 23, 2020 had reached its bottom which was exact are media verifiable.